Graphing Proportional Relationship Worksheets are an exciting tool to learn and apply your understanding of mathematics. They’re all about finding and illustrating the relationship between two quantities that are proportional. Proportional means that the quantities increase or decrease together in a predictable way.
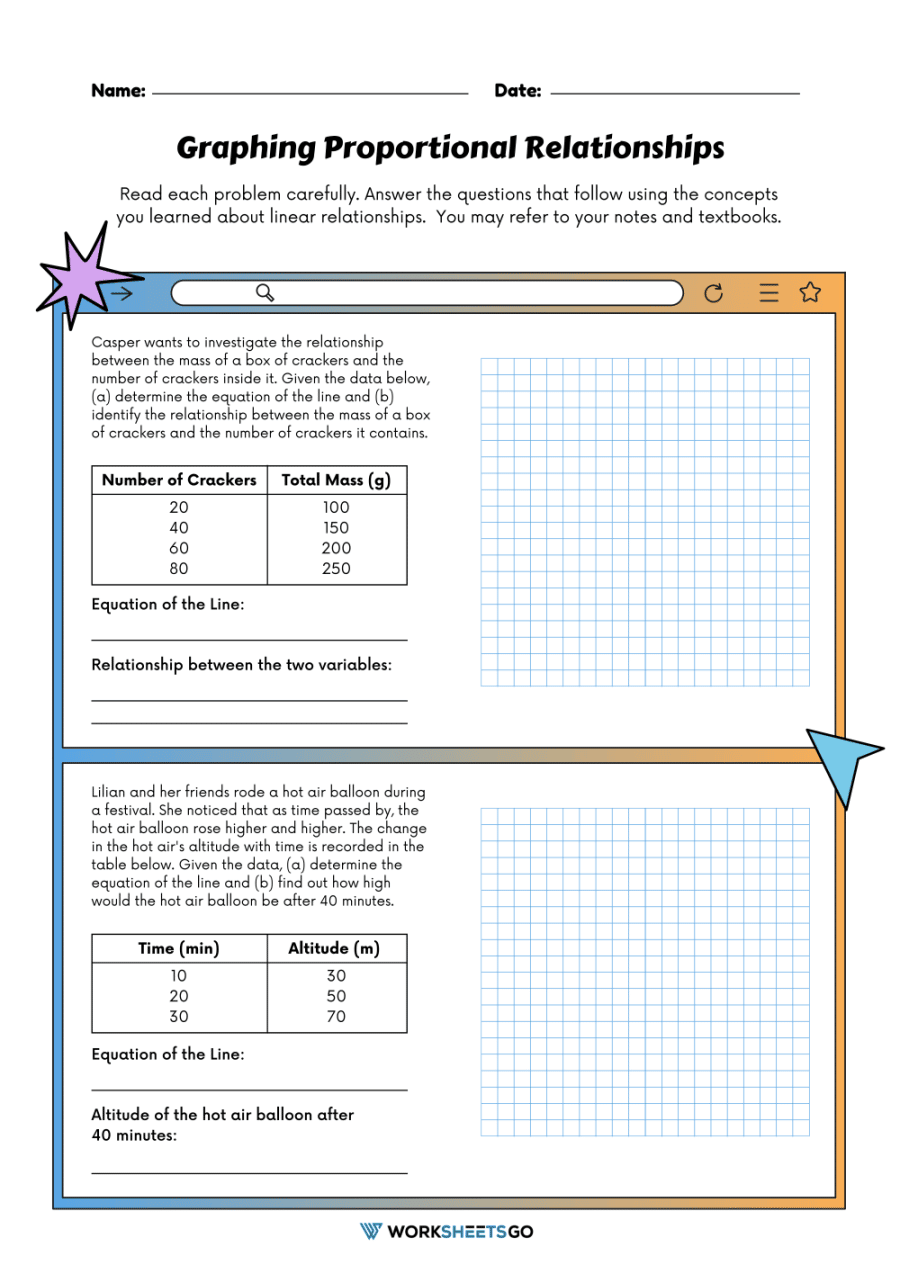
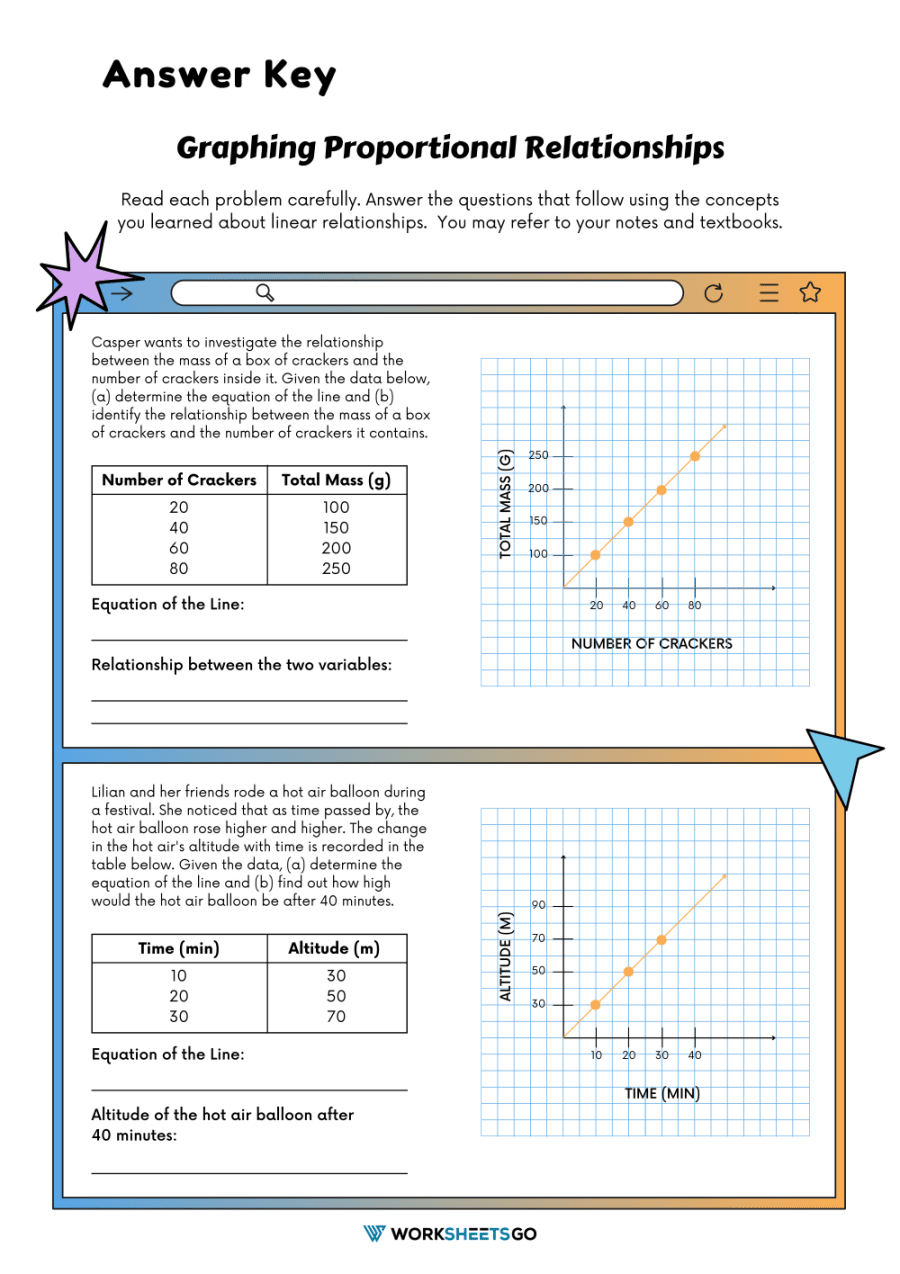
Let’s take an example about Casper and his box of crackers. Suppose Casper has several boxes of crackers, each of different mass because they contain different numbers of crackers. He notices that as the number of crackers increases, the mass of the box also increases. This is what we call a proportional relationship because both quantities are changing in a related way.
Your task is to explore this relationship further by using the given data. Part (a) asks you to find the equation of the line. This equation will represent the relationship between the mass of the box and the number of crackers it contains. It will be in the form of y = kx, where y is the mass of the box, x is the number of crackers, and k is the constant of proportionality that tells you how much the mass changes with each additional cracker.
For part (b), you’re asked to identify the relationship between the mass of the box and the number of crackers it contains. This means you need to describe how the mass changes as the number of crackers increases. If the equation you found in part (a) was, for example, y = 2x, this would mean that for each cracker added to the box, the mass increases by 2 units.
So, when you’re working with Graphing Proportional Relationship Worksheets, you’re practicing to identify, express, and visually represent proportional relationships in a real-world context. It’s a crucial skill that helps you understand how things in our world often relate to each other.

Answer Key


