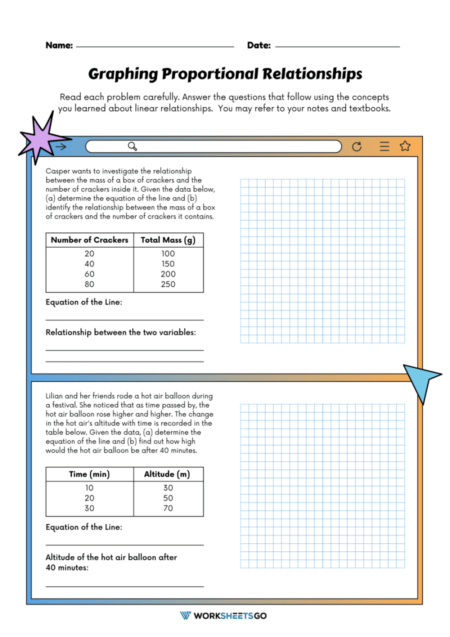
Proportional relationships worksheets are designed to help students understand the relationship between two variables that are proportional to each other. In this particular worksheet, students will be practicing completing a table of values to find the coordinates for points along a straight line graph.
The worksheet will typically include several tables of values with some of the values missing. The students will need to use the provided rule, which will be in the form of an equation such as y = 3x + 2, to fill in the missing values. This equation means that for every value of x, y will be equal to three times that value of x, plus two.
To complete the table, the student would plug in different values of x into the equation and then solve for y. For example, if x is equal to 1, y would be equal to 3(1) + 2, which equals 5. So the coordinate for that point would be (1,5). The student would continue to do this for the other missing values in the table until the entire table is filled in.
The purpose of this worksheet is to help students understand how to graph linear equations and to reinforce the concept of proportional relationships between two variables. By completing the table and graphing the resulting points, students can visually see how the two variables are related and gain a better understanding of how to use equations to model real-world situations.

Answer Key


